
Methods
The purpose of this study was to develop
a method for calculating solar insolation at a high resolution (1
meter) across a large area (the state of Minnesota). The results
were intended to provide a conservative estimate of solar
insolation for determining the suitability of potential
photovoltaic solar installations. This project relies on 800+ GB
of Digital Surface Model (DSM) Rasters covering the extent of
Minnesota. This input data is processed using ArcGIS spatial
analysis functions in a python scripting process. The analysis
creates a sky view for each location of the raster and calculates
incident solar radiation across a year. The overall process
relies on a PostgreSQL database to manage individual tasks and
provides a mechanism to track the progress of the data analysis.
The output product is a 800+ GB Area Solar Radiation Raster.
Video overview:
^^ TOP ^^ NEXT >>
Lidar Data
The primary source data used in this
study was LiDAR elevation points
gathered for Minnesota between 2006 and 2012 and made
publicly available by the Minnesota
Department of Natural Resources and cooperating
agencies.
Lidar is a type of active remote sensing technology where light
pulses (most commonly in the near-infrared wavelengths) are
emmitted from a laser scanner and response times are measured.
The information collected allows data processors to generate a
point cloud, where each point represents one return from a
laser pulse. The input data in this study was collected using
airborne laser scanners mounted to airplanes. The data was
originally collected between 2006 and 2012 through an
intergovernmental initiative with the primary objective of
providing improved elevation data for flood mapping. While we
analyzed this data as a whole, the data is the rusult of a
number of different collection efforts and contracts that have
been made public through the
Minnesota Geospatial Information Office.
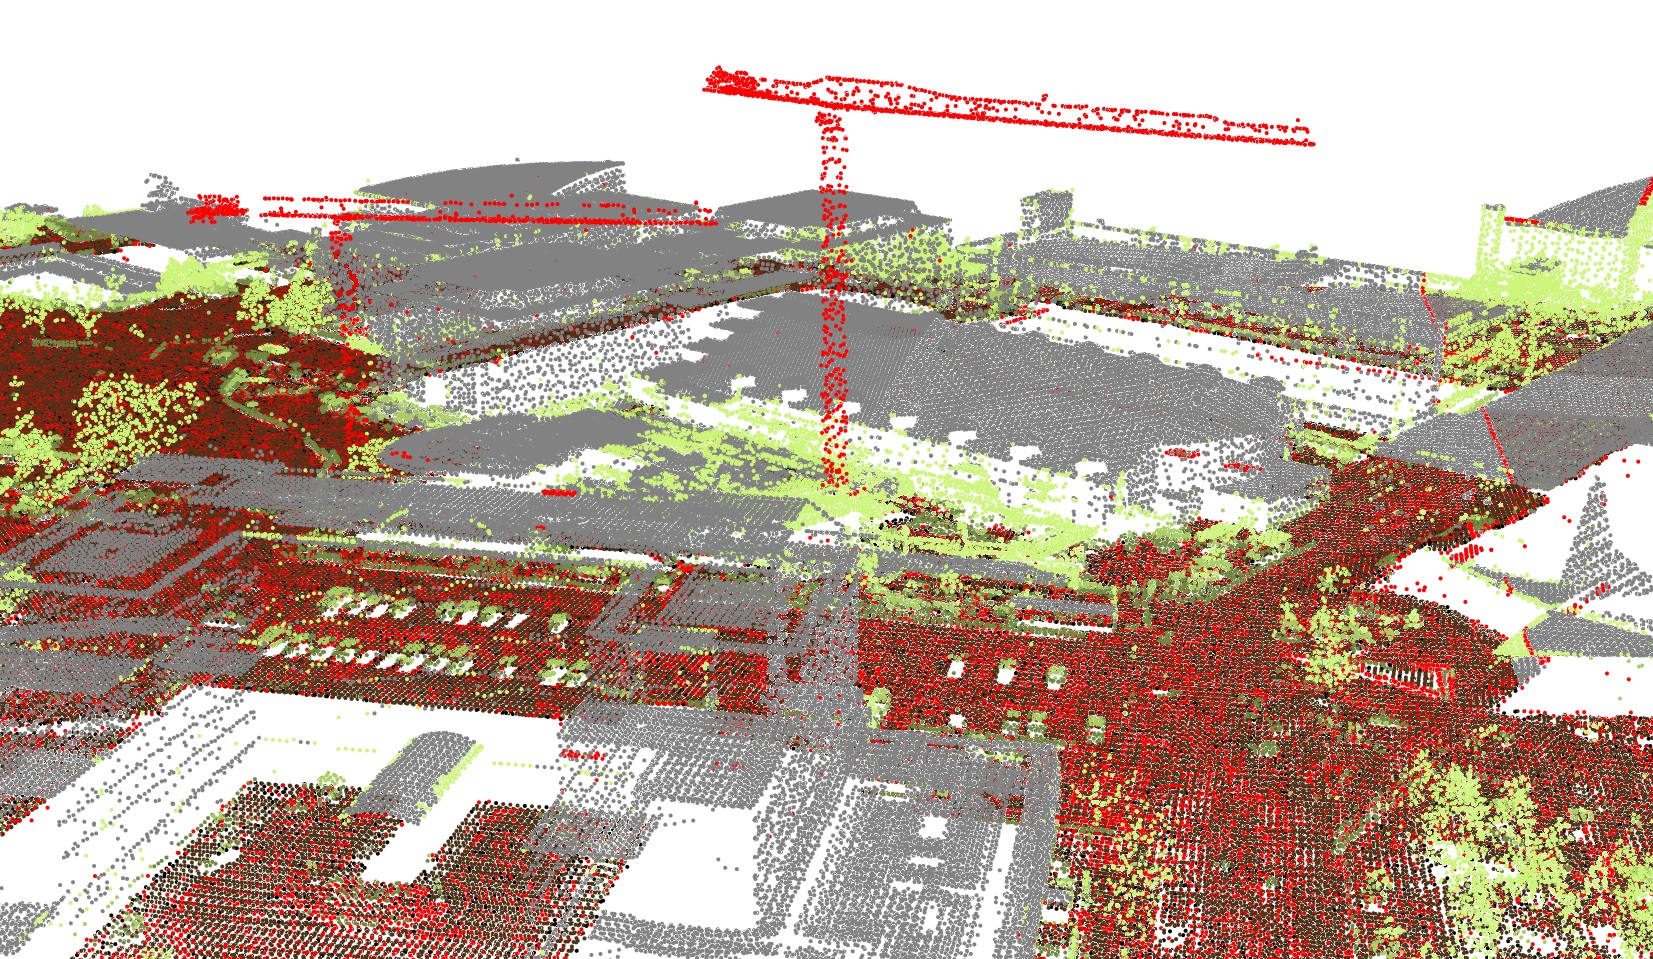
LiDAR Point Cloud of UMN East Bank Campus
<< PREVIOUS ^^ TOP ^^ NEXT >>
Digital Surface Model (DSM) Development
In order to conduct the Solar Analysis process a Digital Surface Model (DSM) was needed to represent the earths surface and all objects that lie above that surface in grid. In other words irregularly spaced lidar points had to be converted into a grid (raster) whereby each point (pixel) represents the elevation at that location. We generated our DSM using a Streaming Delauney Triangulation process developed by Martin Isenburg (now part of the LAStools software package). Triangles are iteratively generated using nearby lidar returns and values for each point are determined by extracting interpolated elevation from the surface of the triangle.
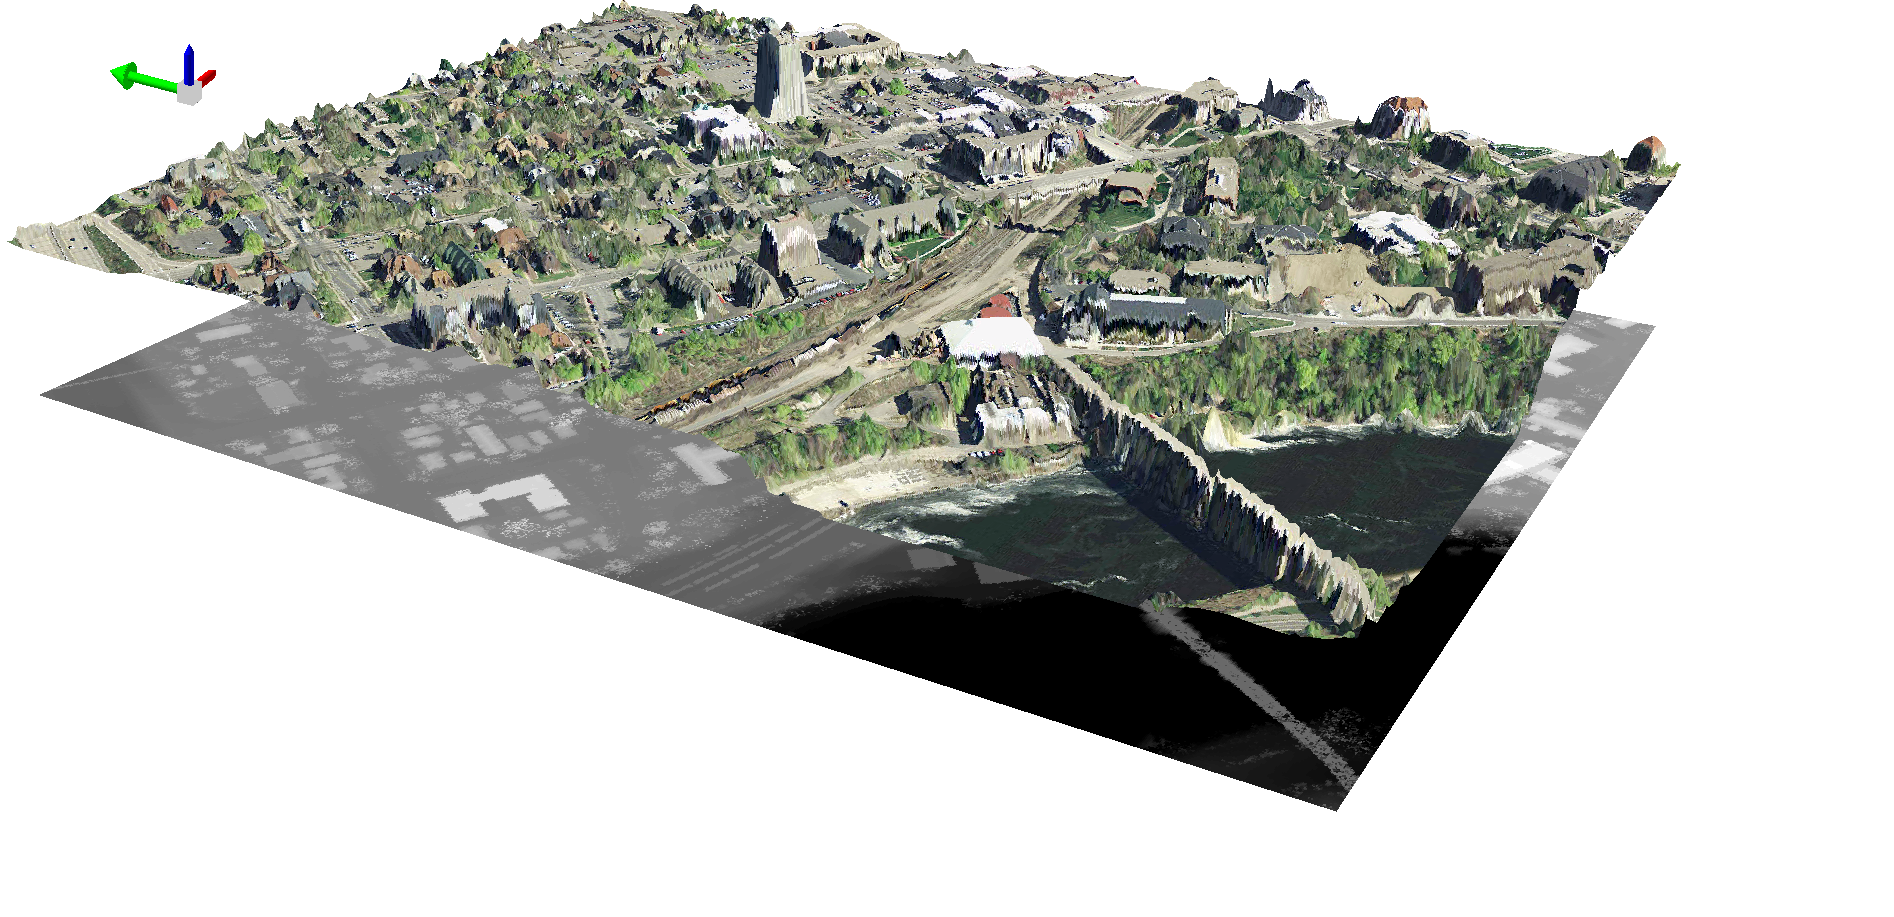
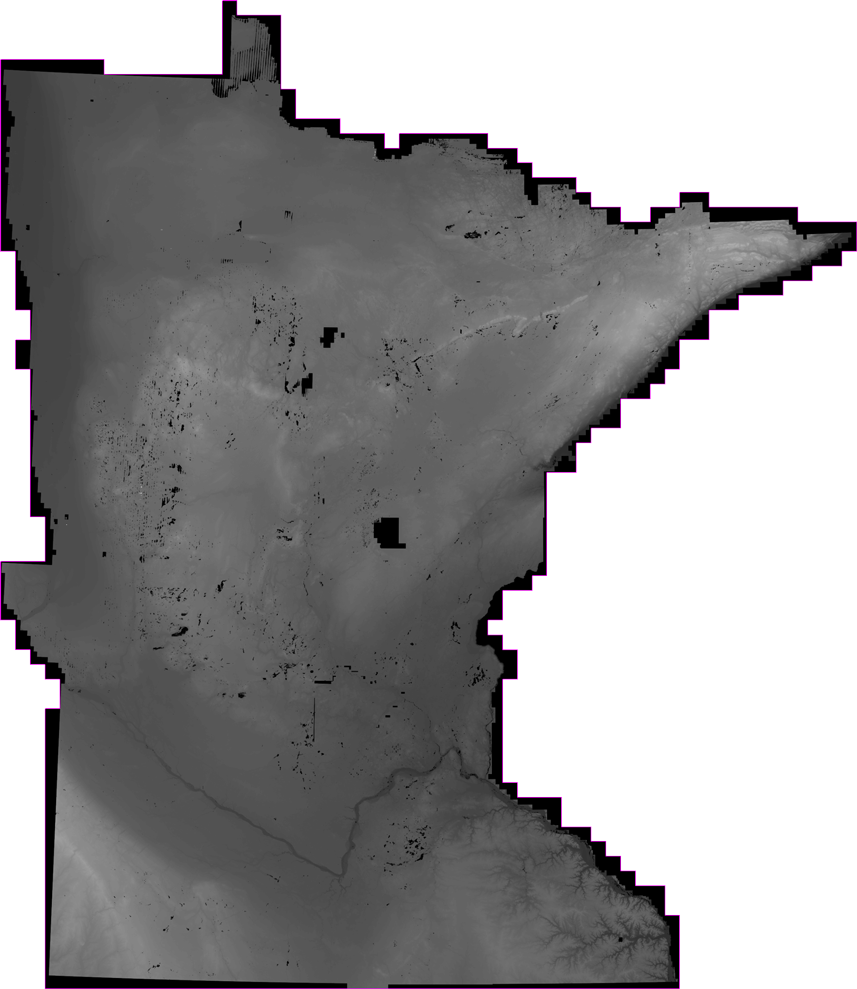
ABOVE: A lidar-derived elevation raster DSM (of Dinkytown, MN) draped by an aerial photo for demonstration. The photo is stretched according to the elevation values of each corresponding cell in the DSM. BELOW: A screenshot of our state-wide DSM. Here dark colors represent low elevation and lighter color = higer elevation.
< < PREVIOUS ^^ TOP ^^ NEXT >>
Solar Radiation Analysis
The Solar Radiation Analysis is completed using
ESRI's ArcGIS Spatial Analyst software via Python programming and the
ArcPy package. The
Area Solar Radiation tool allows the user to input a DSM to
analyze the landscape and the sun's path across the sky
(throughout the day and the year) to measure the amount of
incoming direct and diffuse solar radiation for a particular
place on the landscape.
These calculations, which can be performed for point locations
or entire geographic areas, are carried out using these four
steps:
- An upward-looking hemispherical viewshed is calculated based on topography.
- The viewshed is overlaid on a direct sunmap to estimate direct radiation.
- The viewshed is overlaid on a diffuse skymap to estimate diffuse radiation.
- The process is repeated for every location of interest to produce an insolation map.
For our analysis, these calculations are repeated for every square meter across Minnesota.
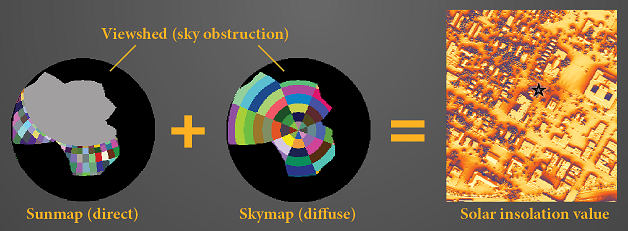
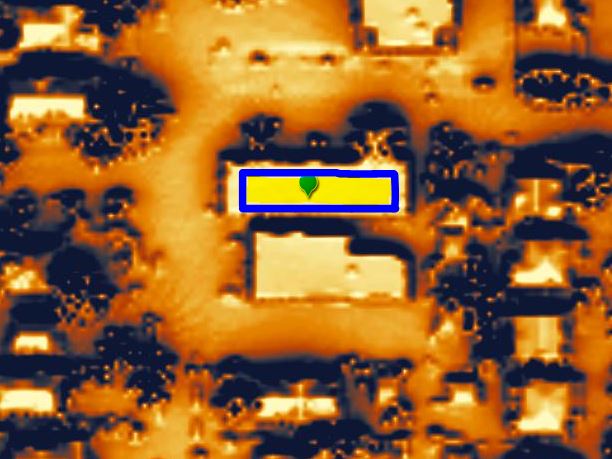
For each location in the output raster, the Area Solar
Radiation tool utilizes the DSM to create a sky obstruction
view. This sky obstruction view is an upward facing circular
view depicting the portion of the sky visible at this location.
The skyview limits the amount of area direct radiation can be
captured by looking at the elevation of nearby features (such
as trees, buildings, hills, etc.). Next, sunmaps (sun
position/direct radiation throughout the day and the year) and
skymaps (directional diffuse radiation for each sky sector) are
taking into consideration. Direct + diffuse radiation,
constrained to the viewshed and calculated as represented
above, yields total solar insolation for each one meter cell
measued in watt-hours per meter2. The equation pictured above
represents the starred point, a rooftop in close proximity to
several tall buildings.
BELOW: More interesting imagery...these animations represent
sunlight analysis throughout the day and the year for
Dinkytown, MN. These images are intermediary data products
extracted from the process described above.
Sunlight throughout the day in Dinkytown on July
4th.
Sunlight throughout the year. See why South facing is
preffered?
< < PREVIOUS ^^ TOP ^^ NEXT > >
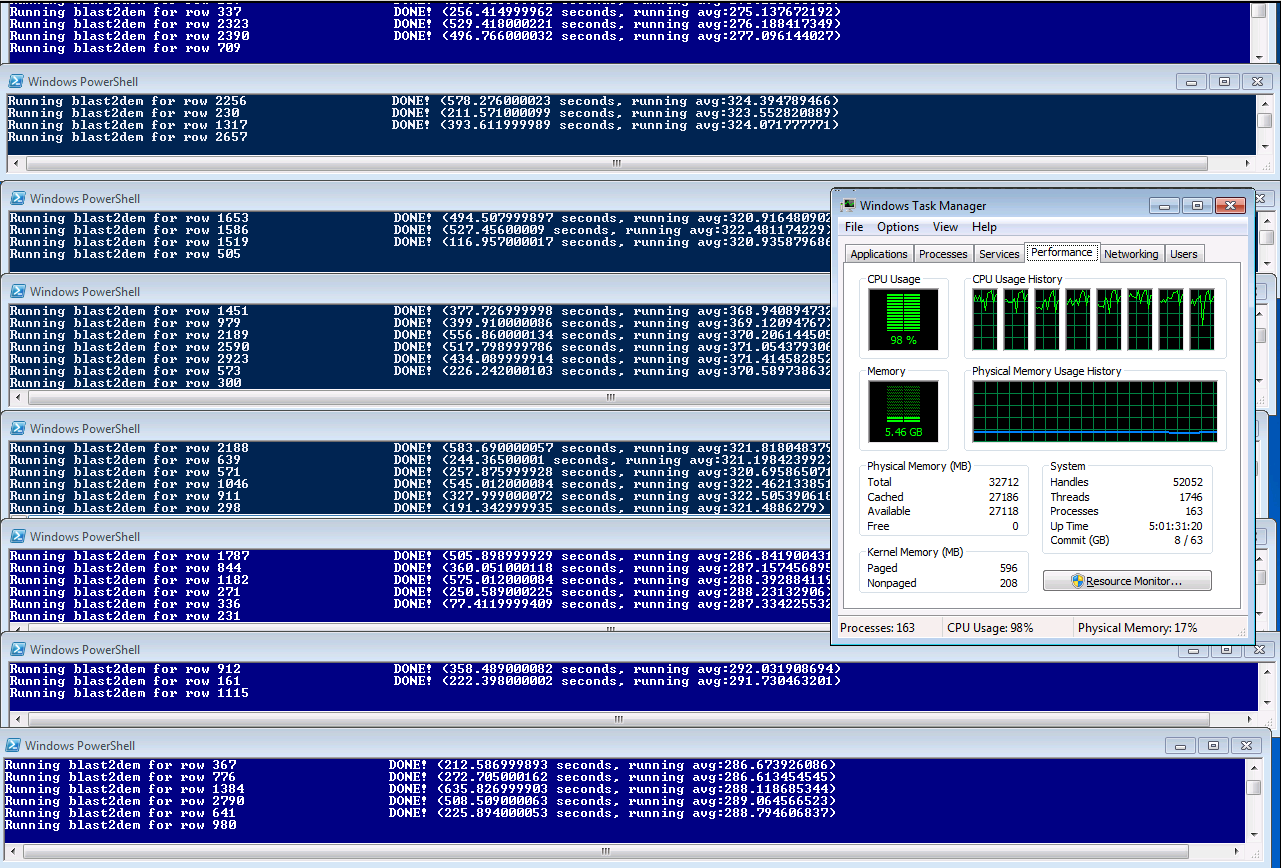
Parallel Processing
Lidar for Minnesota amasses 940Gb of data (compressed as
.laz files). Calculating solar capacity for every square meter
of the state would take about 1,000 days on an average desktop
computer running a sequential process. Using Python and a
PostGIS database for storing metadata and tracking progress we
wrote software that:
- Uses fishnets to divide the state into manageably sized tiles that function as a job queue
- Efficiently generates DSMs by spatially querying only the necessary .laz files for each tile
- Avoids edge artifacts by buffering input and constraining output to coincident boundaries
- Creates a mosaic dataset of DSM rasters from which Area Solar Radiation input is extracted
- Runs effectively on Minnesota Super Computing’s “Itasca” High-performance cluster using ArcGIS Server for Linux
Breaking this project into manageable jobs required creating a database system that divides the work, and an aggregation process that produces a seamless output. PostgreSQL with PostGIS extension were used to manage the individual analysis jobs and track the progress and processing time for each job. The processing size chosen was 1 square kilometer, which resulted in a total of 220,165 individual jobs for the state of Minnesota.
The below animation is symbolized based on the time stamp of a tiles completion.
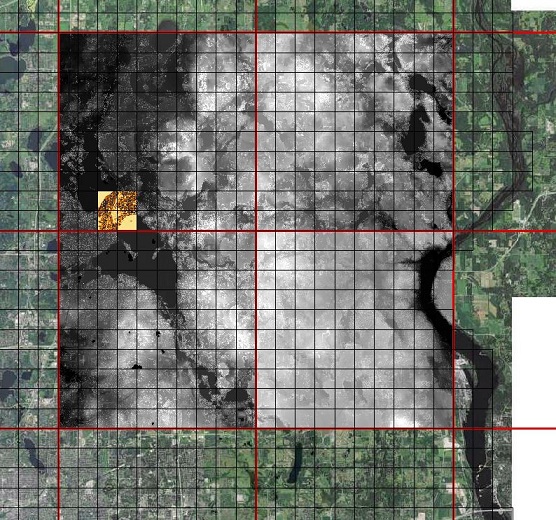
Data tiling structure with DSM processing extents (red) and Solar Analysis processing extents (black).
Solar radiation modeling is computationally demanding and
complicated to implement. Our database control structure
comibined with the "embarrassingly
parallel" nature of our model, much of the analysis to be
quickly computed using Minnesota Supercomputing
Institute's High Performance Computing resources as well as
virtual machines and entire labs of desktop computers.
To learn more about processing methods and tool parameters used
in our analysis, visit the ![]() Github
project site
Github
project site ![]() where all of the
scripts utilized can be accessed in full.
where all of the
scripts utilized can be accessed in full.
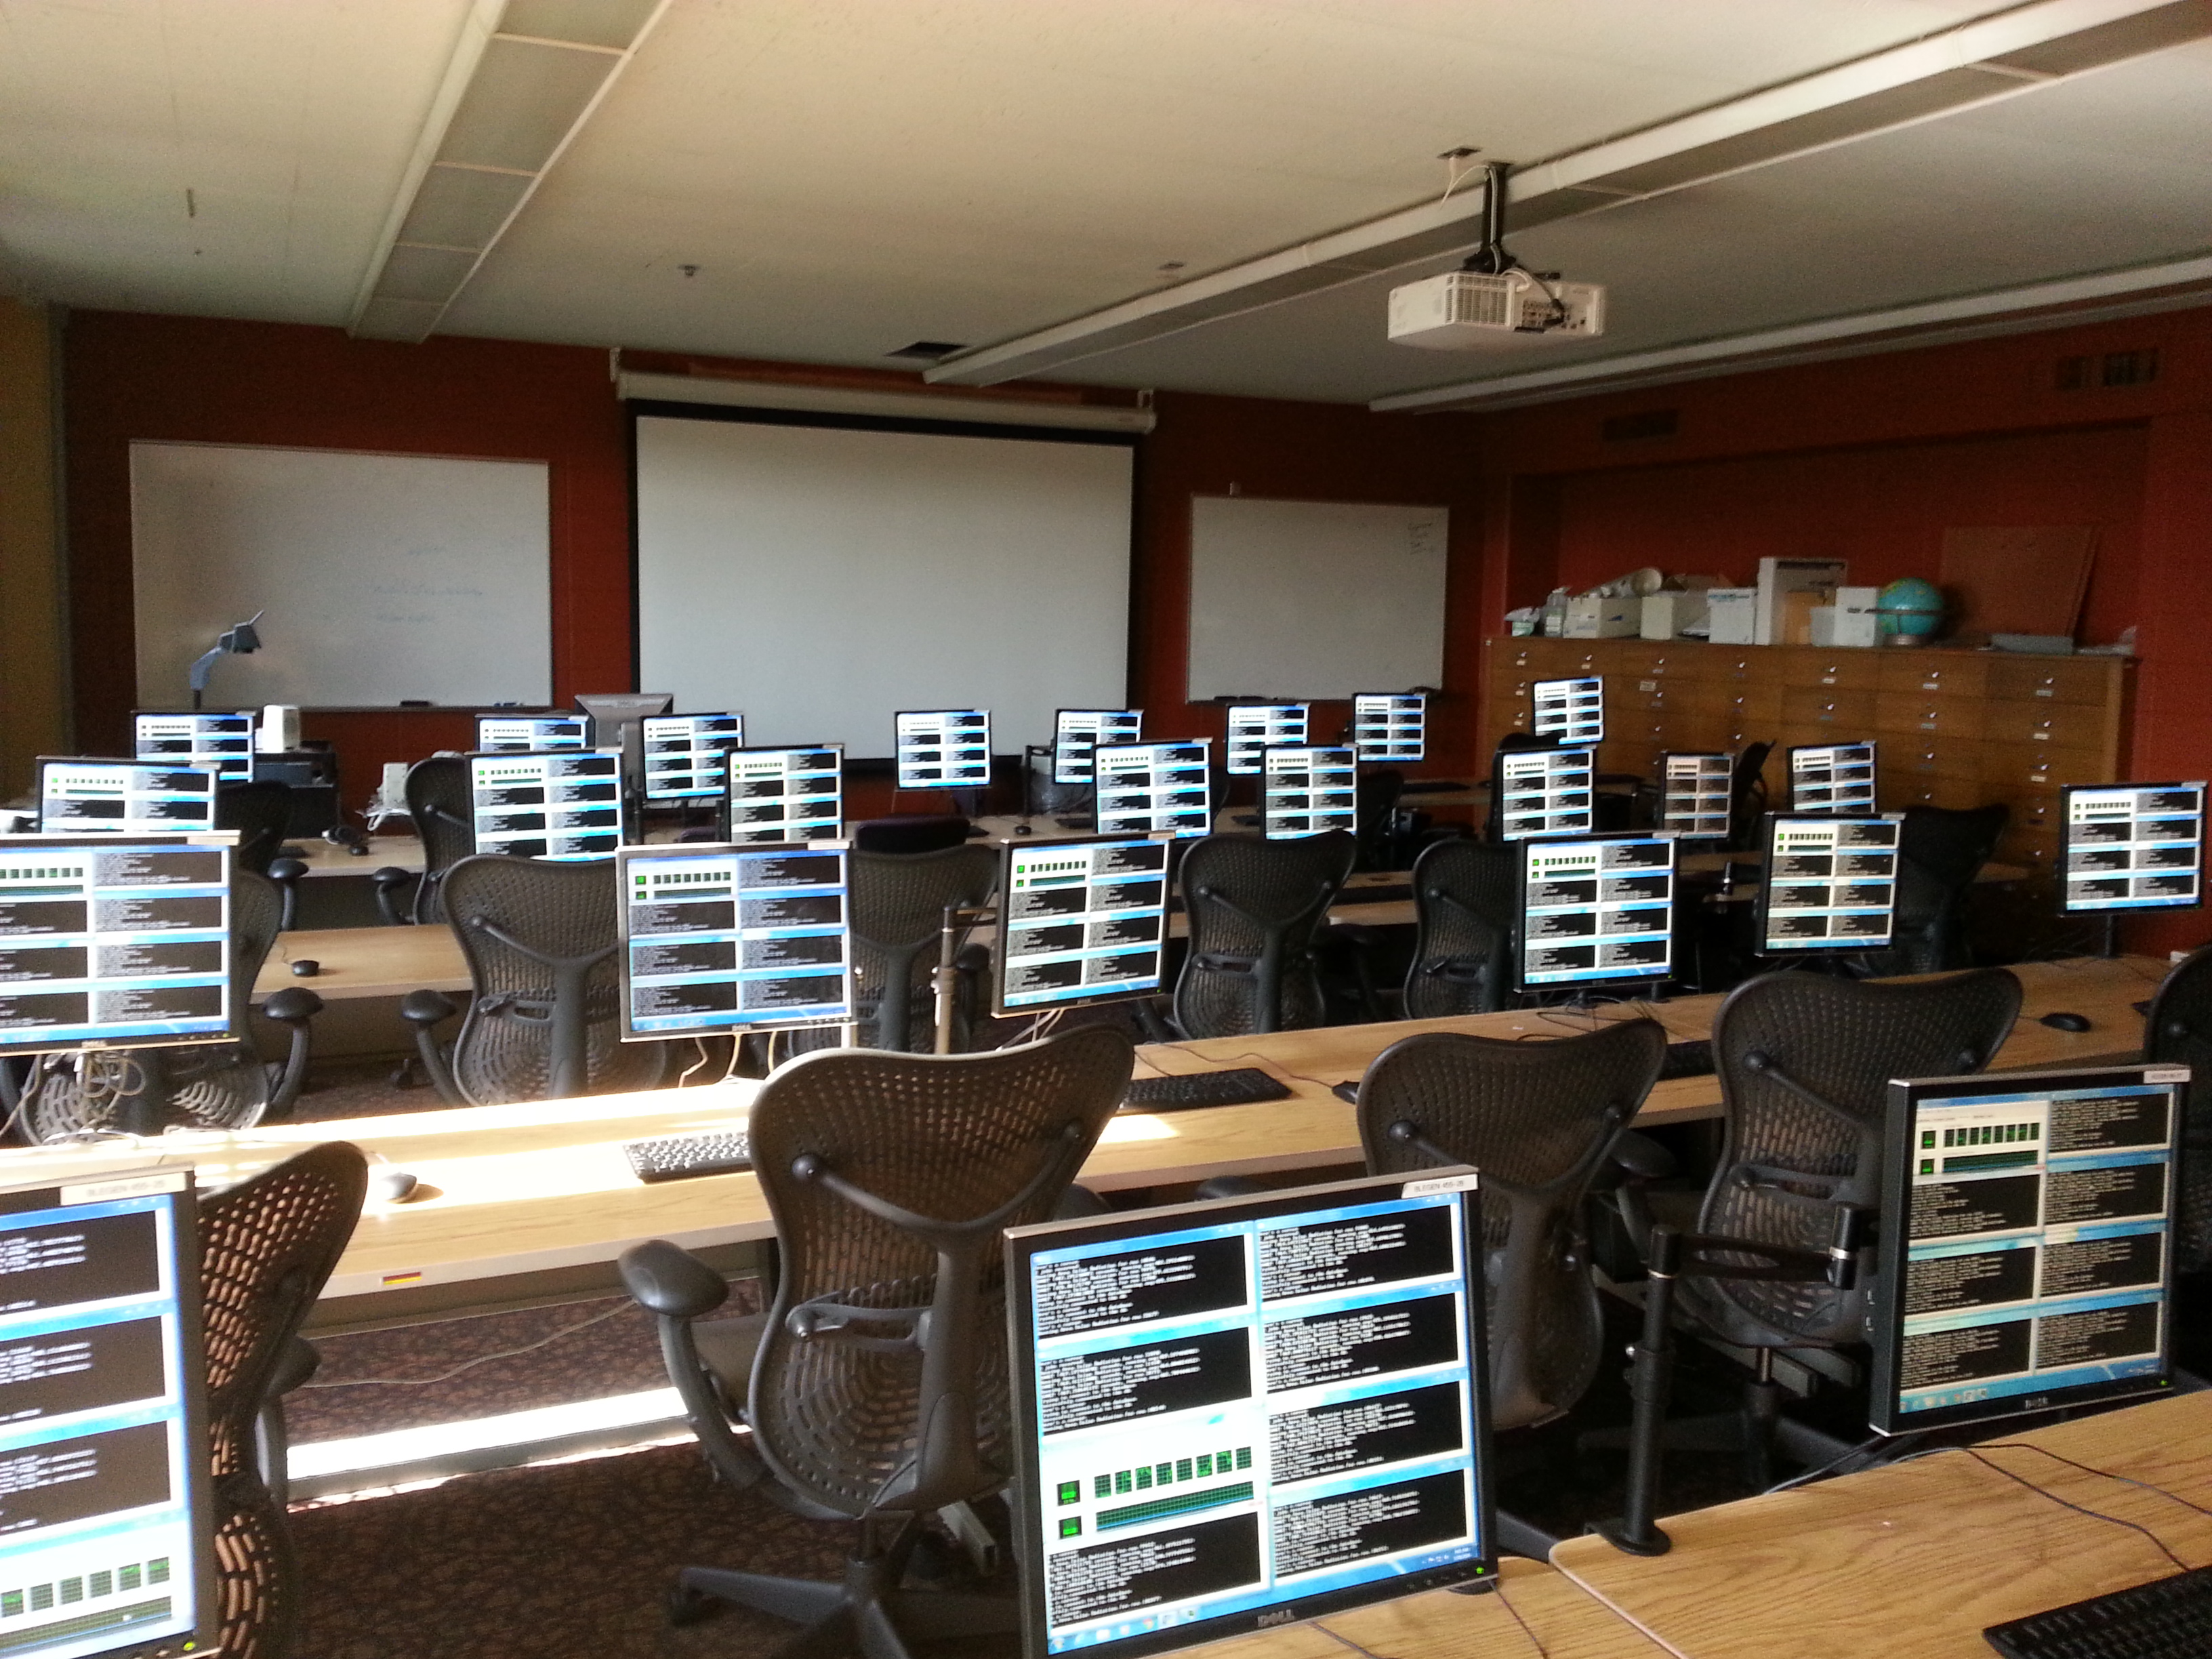
ABOVE: All machines in a Blegen Hall lab processing Solar
data during Spring Break.
BELOW: We ran as many processes as possible on each
machine.
< < PREVIOUS ^^ TOP ^^ NEXT >>
App Development
In recent years the decrease in price and increase in demand for solar panels has not be met by an increase in publicly available information for site suitability analysis to determine ideal solar panel placement. For homeowners or businesses potentially interested in a PV solar system, there is a demand for more detailed information before reaching the step of hiring a solar installer. Solar insolation varies by latitude and climate, but the most important factor affecting small scale photovoltaic (PV) solar installations is intermittent shading due to adjacent structures and trees.
The purpose of this study was to develop a method for conducting shade analysis to calculate solar insolation at a high resolution (1 meter) across a large area (the state of Minnesota). The results were intended to provide a conservative estimate of solar insolation in kilowatt-hours (kWh). The primary data used in this study was Lidar elevation points gathered for Minnesota counties between 2006 and 2012 and made publicly available through the Minnesota Department of Natural Resources. The analysis was completed using a combination of proprietary and open-source Geographic Information Systems (GIS) technology. This study was designed to provide maximum utility for a variety of applications. The resulting data can be integrated into existing maps and Geographic Information Systems, and it can be combined with local data for further analysis.
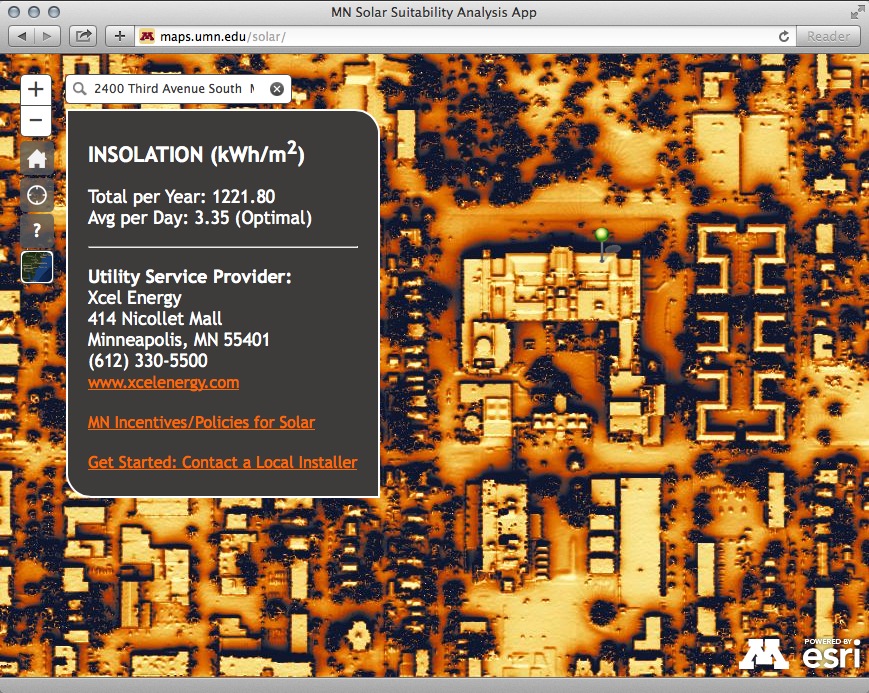
The original web app interface
A simple interactive map viewer was developed to visualize the processed data. Many enhancements have been made since then, and there are a number of possibilities for further expansion. The original application could only perform a simple point query of total yearly insolation in kWh. The new app makes use of server-side processing to expand the query to real-time shading analysis. A selected point returns values for monthly insolation as well as sun hours.
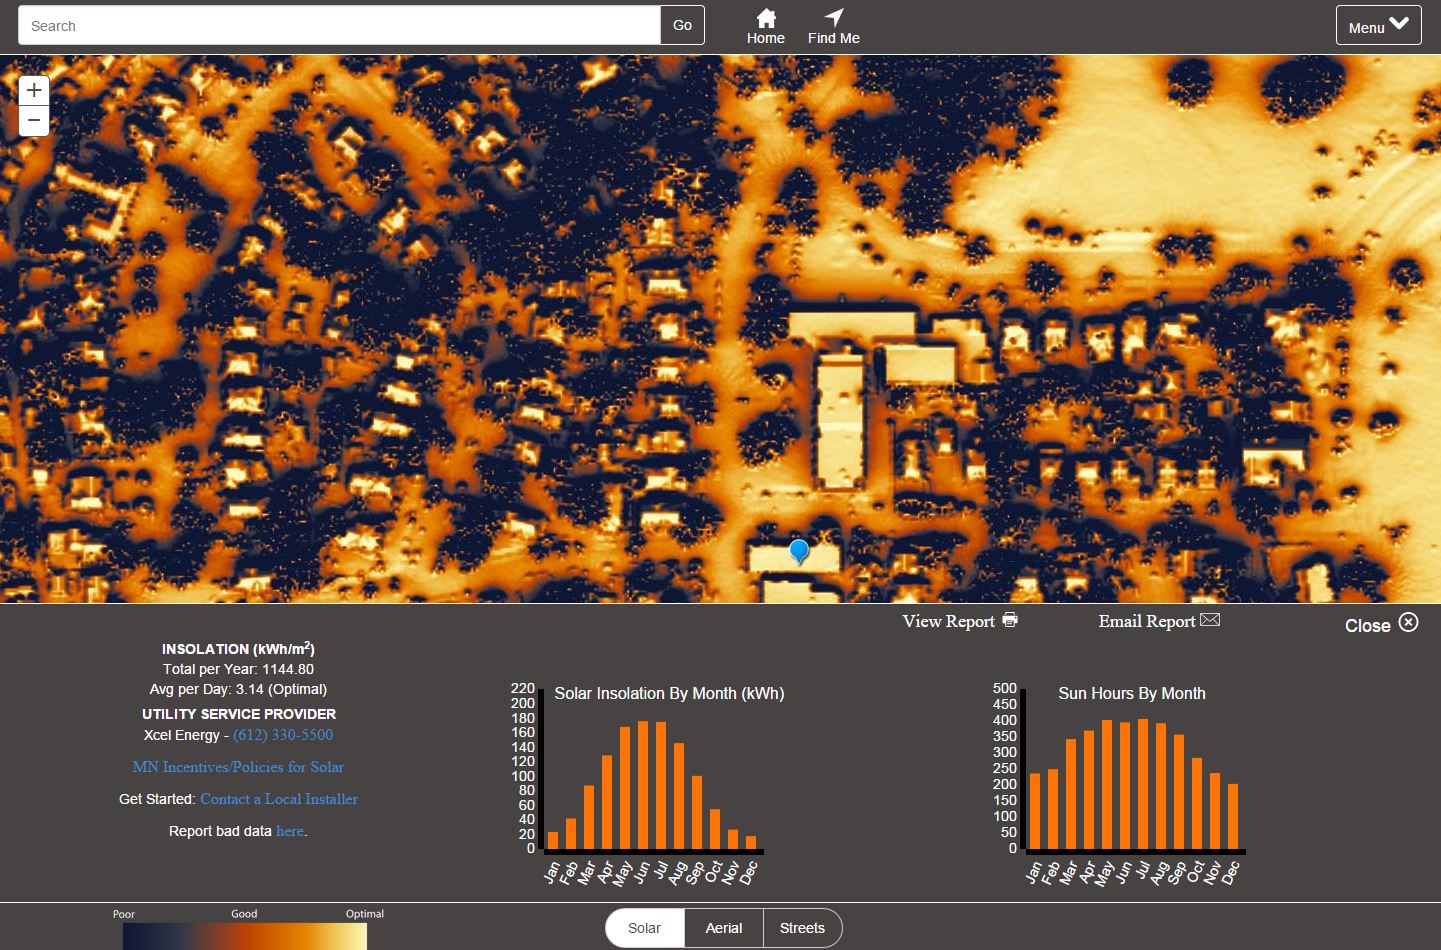
The new web app interface
The first map had no formal method for offline output. The new map includes a printable location report, so that users can analyze a site and share the results. This report may also be emailed.
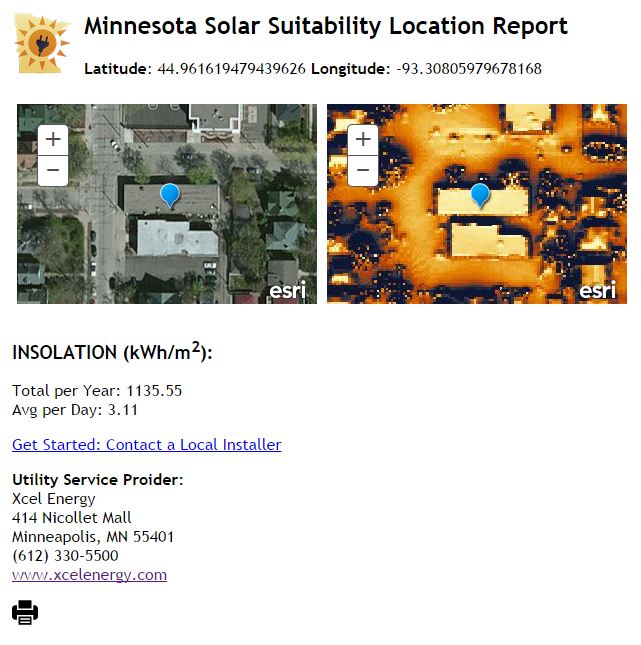
A printable location report
There are a number of ways we can enhance functionality in the future. Most notably, the data makes it possible to estimate energy production and costs. We will work with solar industry experts to define the variables needed to complete these estimates, such as equipment efficiency. For planning an installation, it would also be helpful for users to be able to draw rectangles in the app. From there we could estimate total system size and calculate the insolation across the whole area. Ideally, the app would allow a homeowner to calculate their return on investment for a PV solar system.
Example of drawing functionality
<< PREVIOUS ^^ TOP ^^