
Main navigation | Main content
For more information about the availability of data products, contact the U-Spatial help desk.
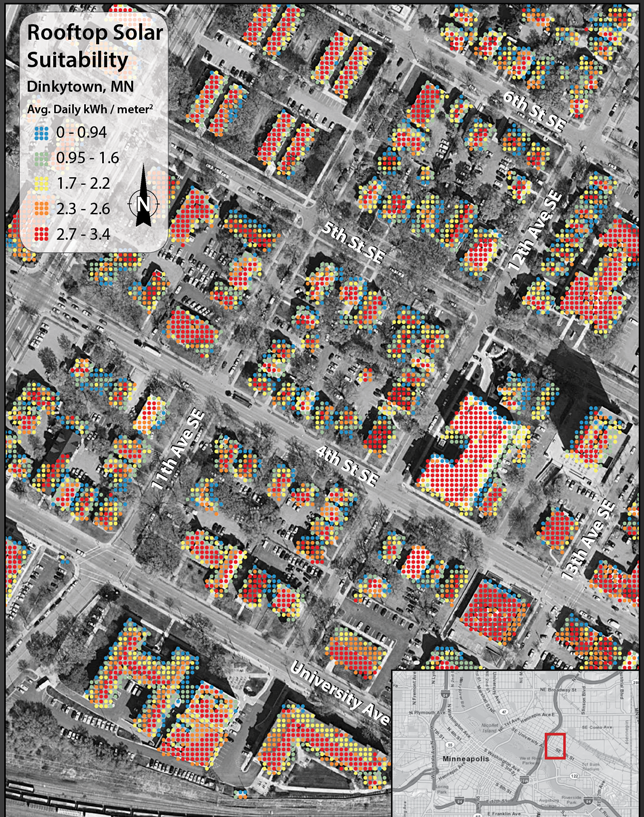
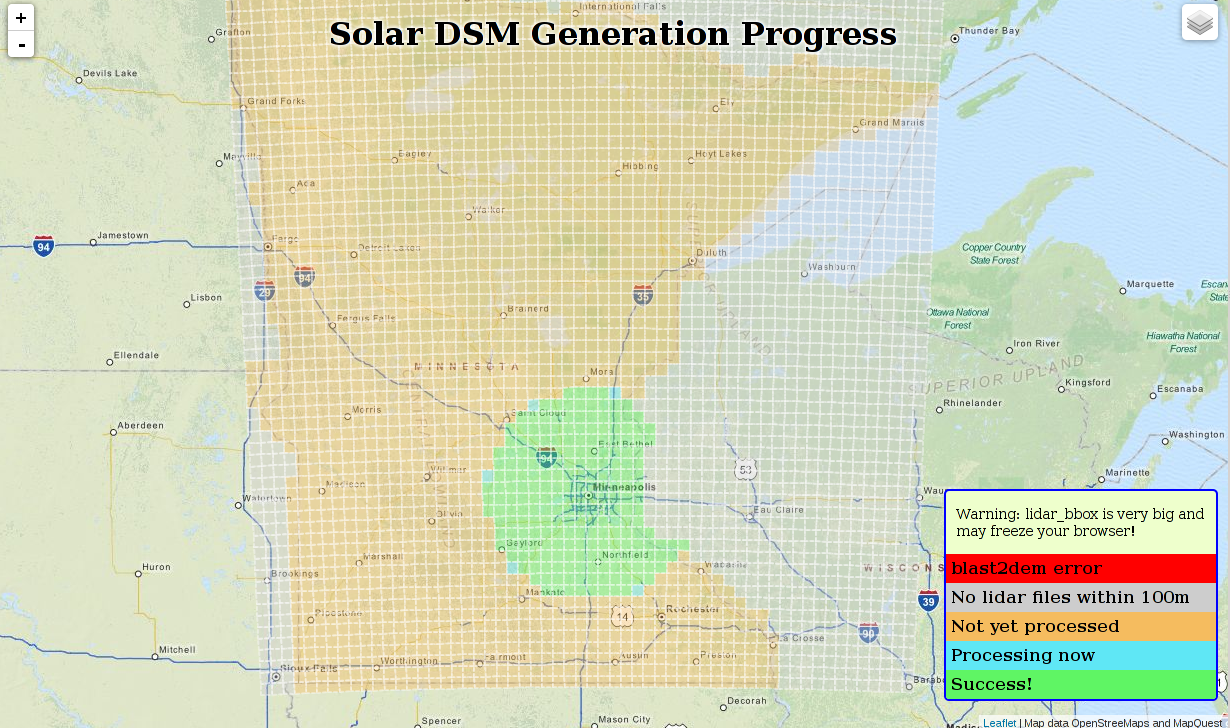
To view and query insolation values by location view our webmap.
Please click here for a list of current issues with our data.
Pending a full production license for one of the software tools used, the data will be made available for public consumption through a web map service (WMS), or on other media upon request.
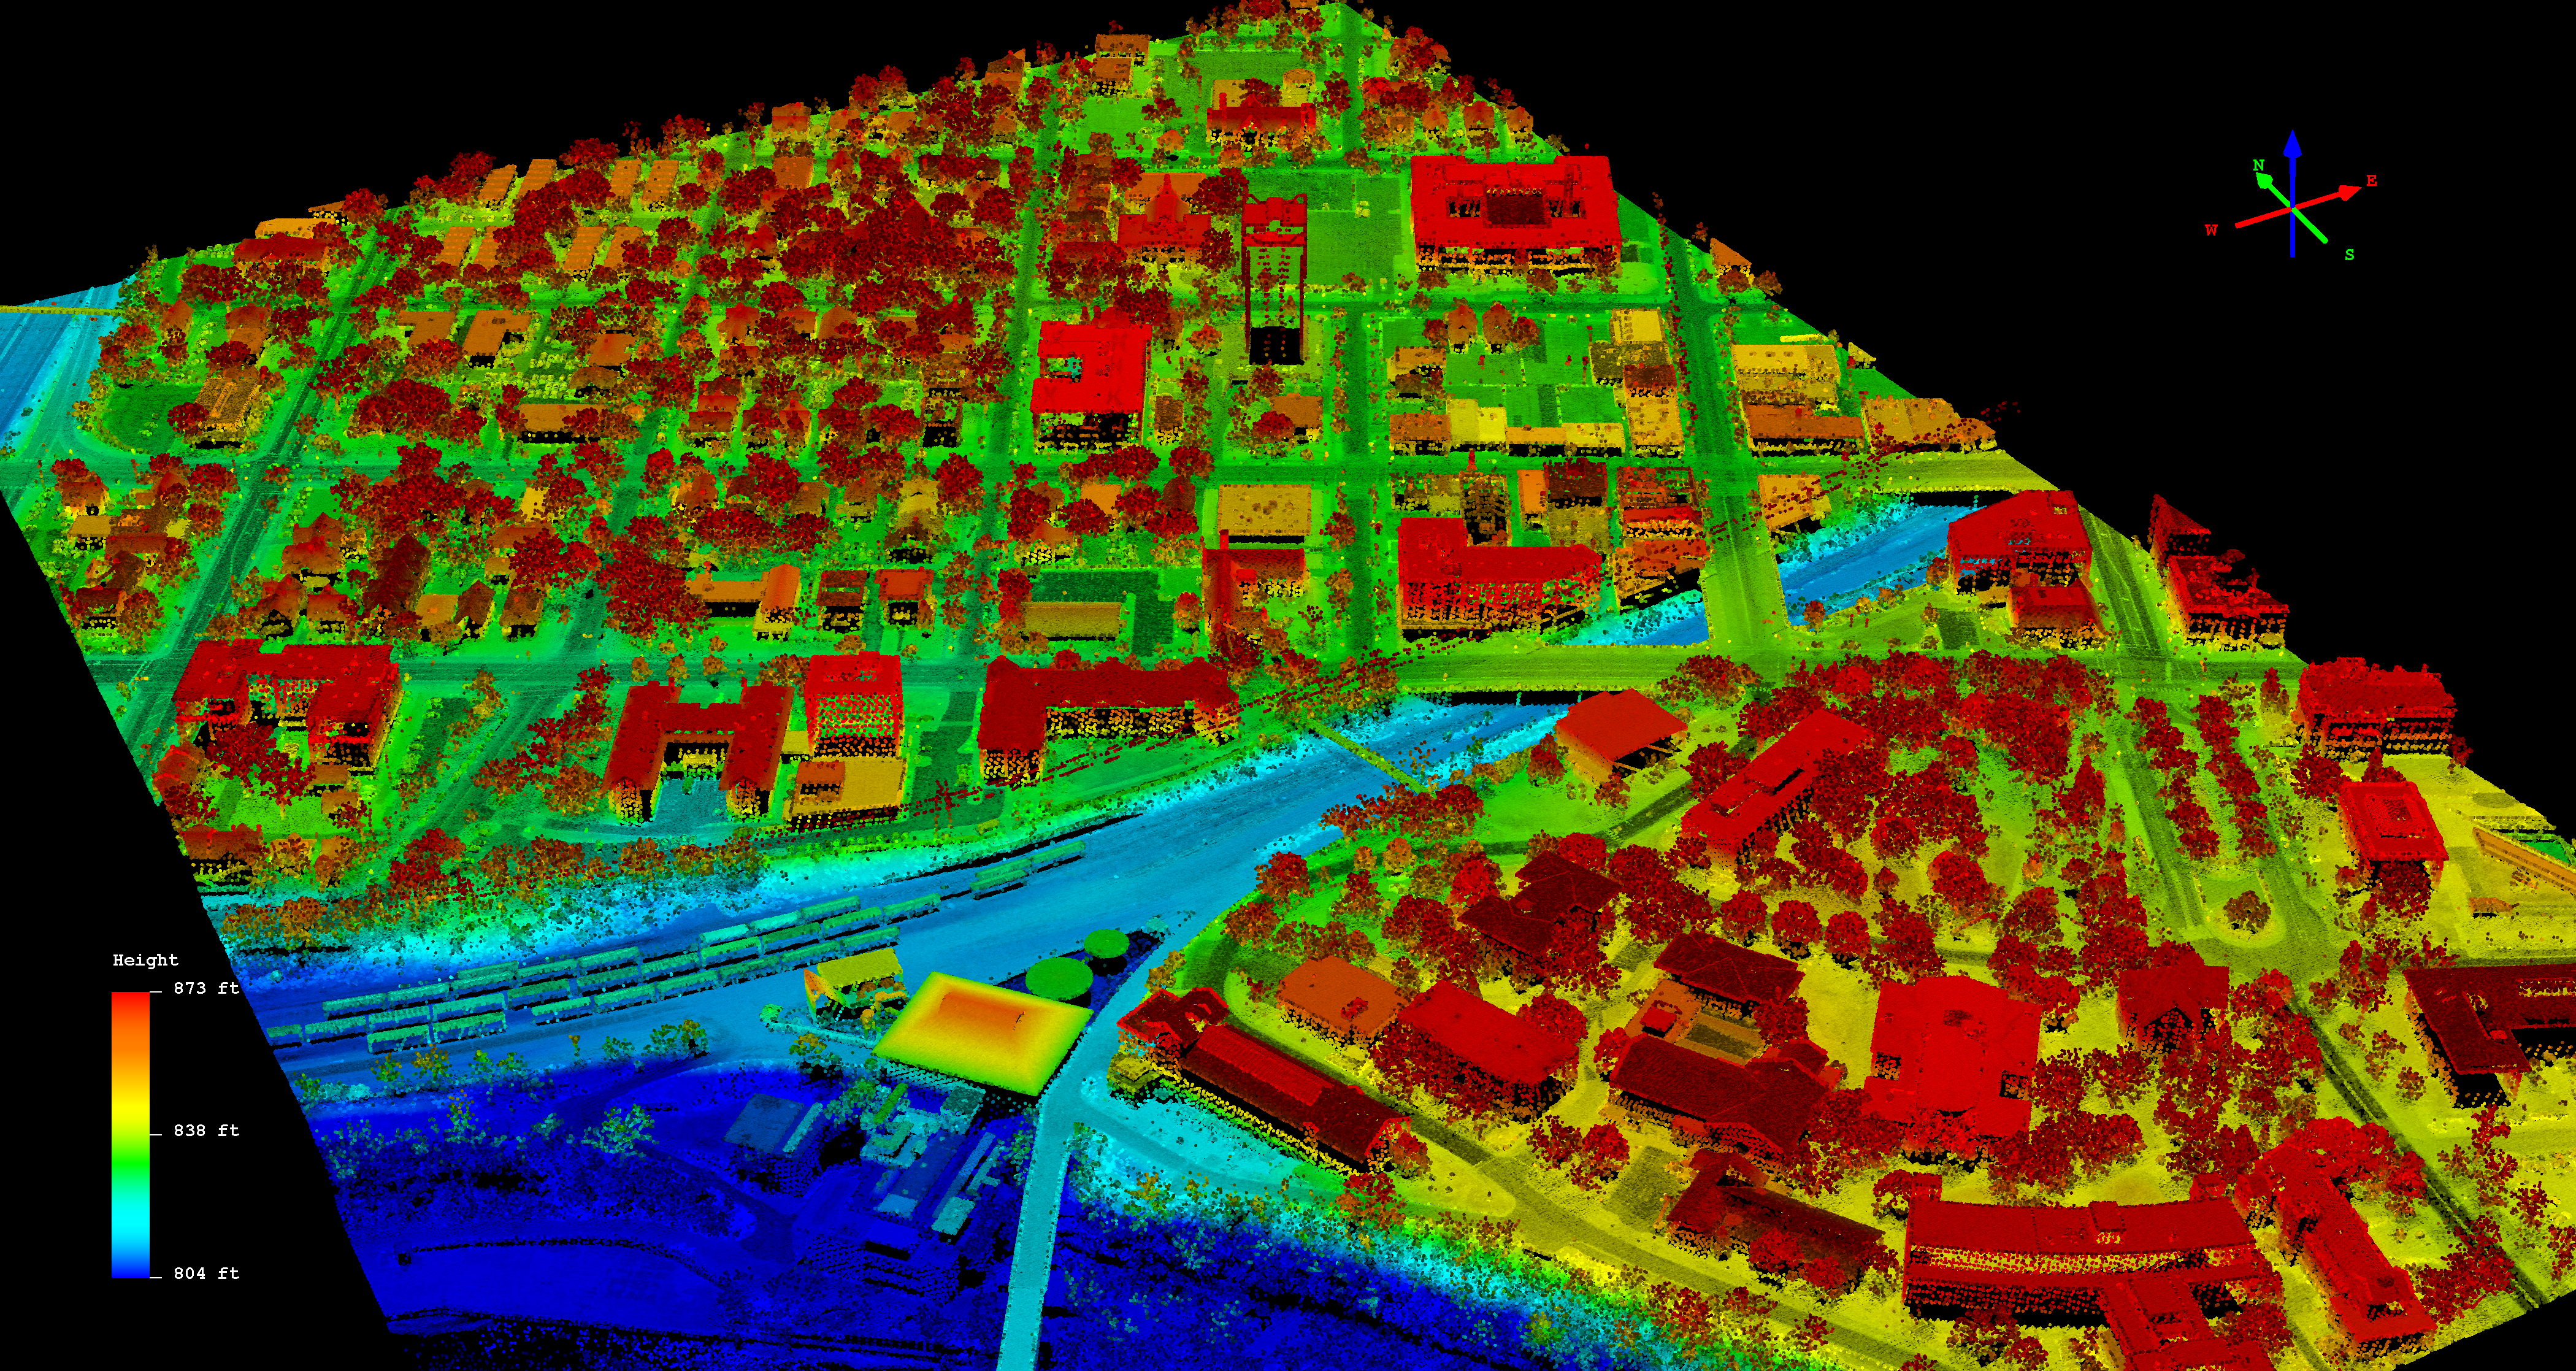
As an intermediate data product we created a 1 meter DSM (digital surface model) for the entire state. If you are interested in this data please email the U-Spatial help desk.
"I used the map today to determine whether to include an additional roof for Solar placing on a group of buildings. It was going to be touch or go whether I was going to include it in an initial quotation. I can now make my determination instantly!" - Matthew Blackler, Founder, ZEF Energy
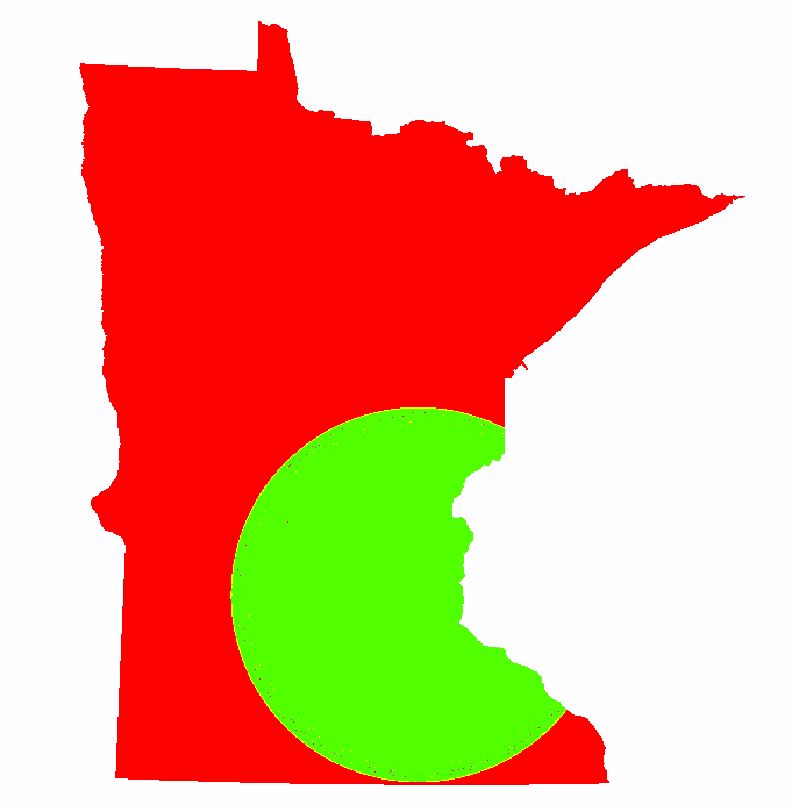
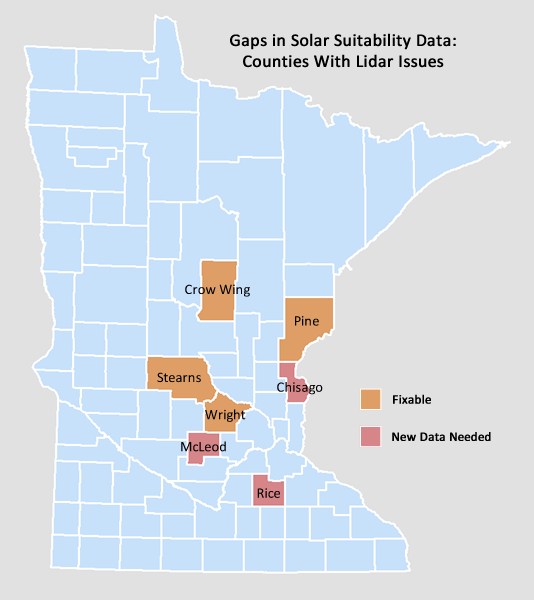
There are presently what appear to be large "gaps" in the solar suitability data available via our app. These gaps correspond to areas where the existing publicly available county level lidar data did not conform to the standards used for the rest of the state due to early adoption from these counties. The data provided by these counties was either missing full classification of lidar points other than "ground" (buildings, vegetation, etc.), or the non-ground point returns were removed entirely. Our processing model ignored unclassified points, resulting in a digital surface model devoid of non-ground features for these areas, creating what look like county-wide swaths with no shade.
We are currently working to remedy these blank areas where suitable data exists. However, non-ground returns are totally absent for three counties, and new data will need to become available before they can be fixed.
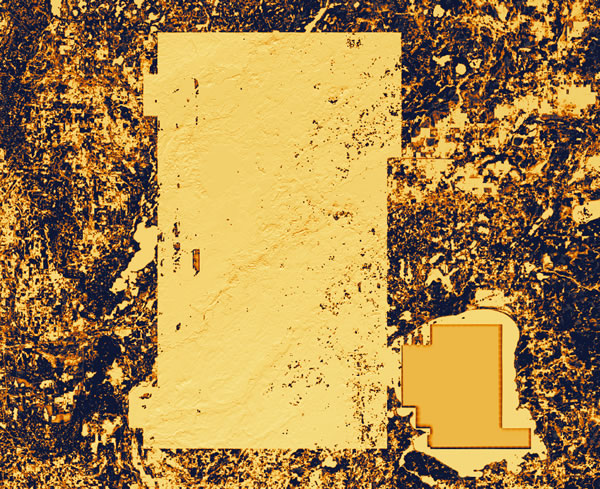
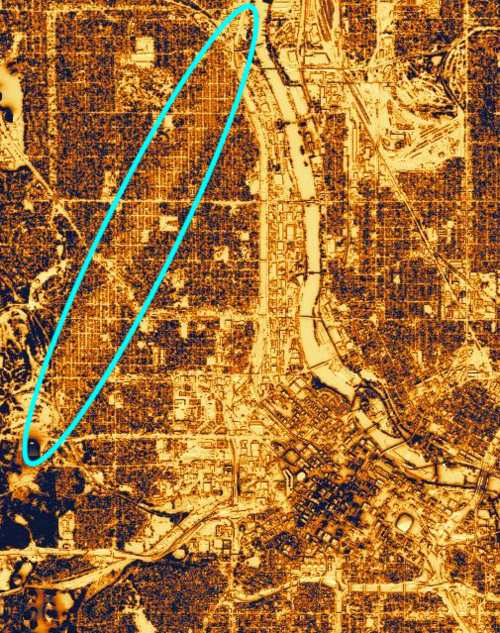
Incomplete solar data is evident in Crow Wing County.
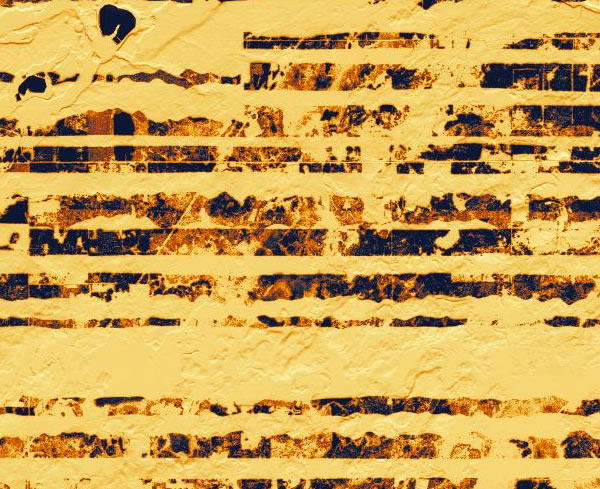
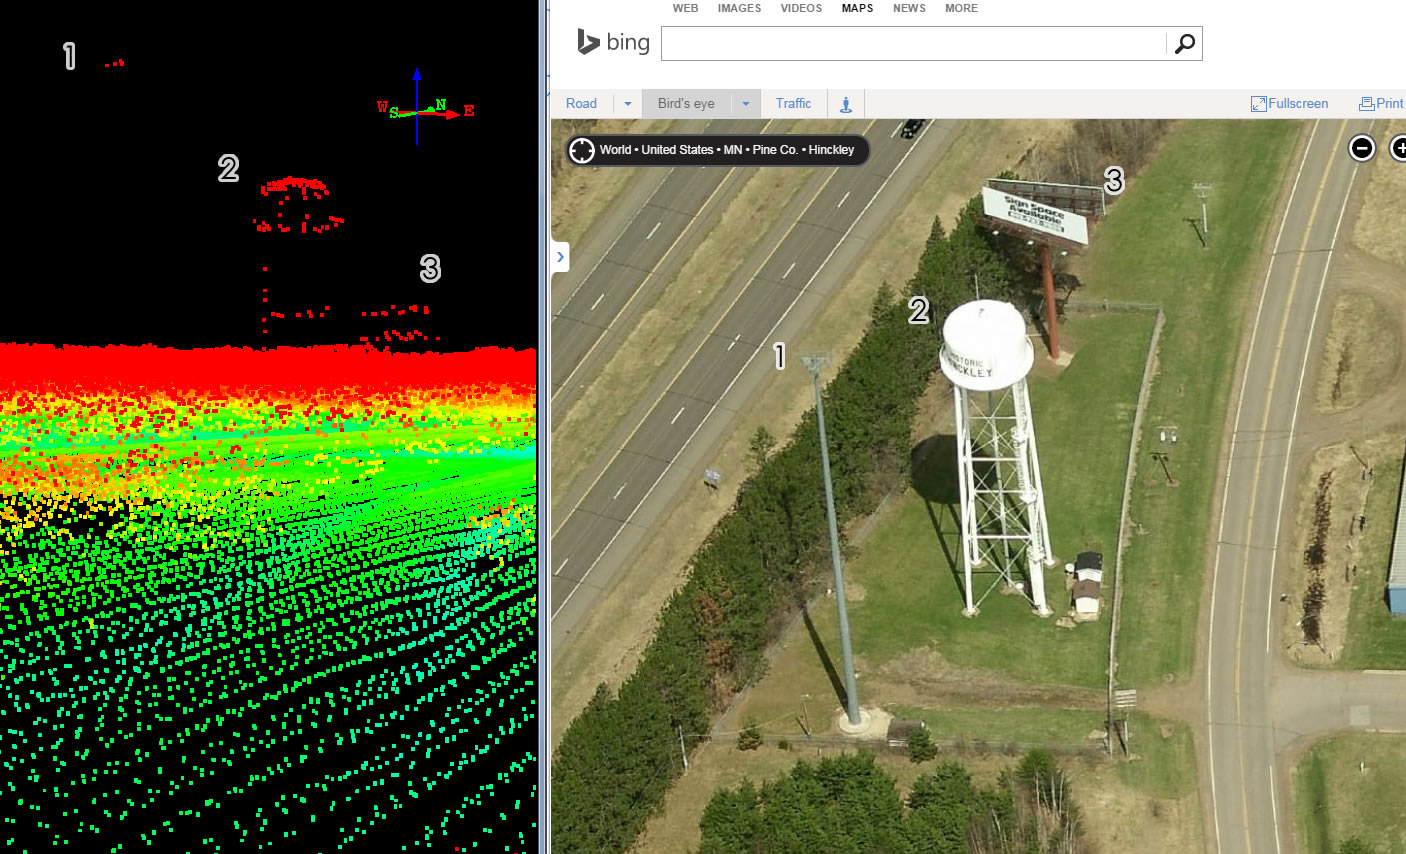
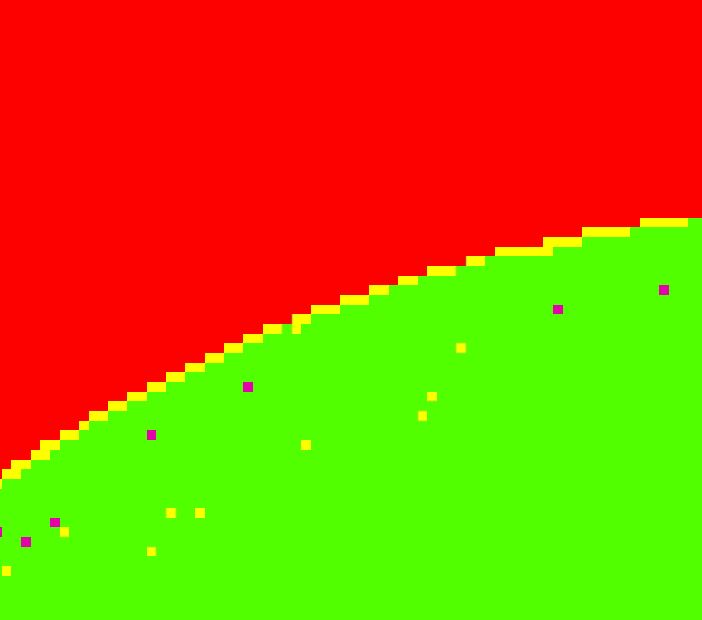
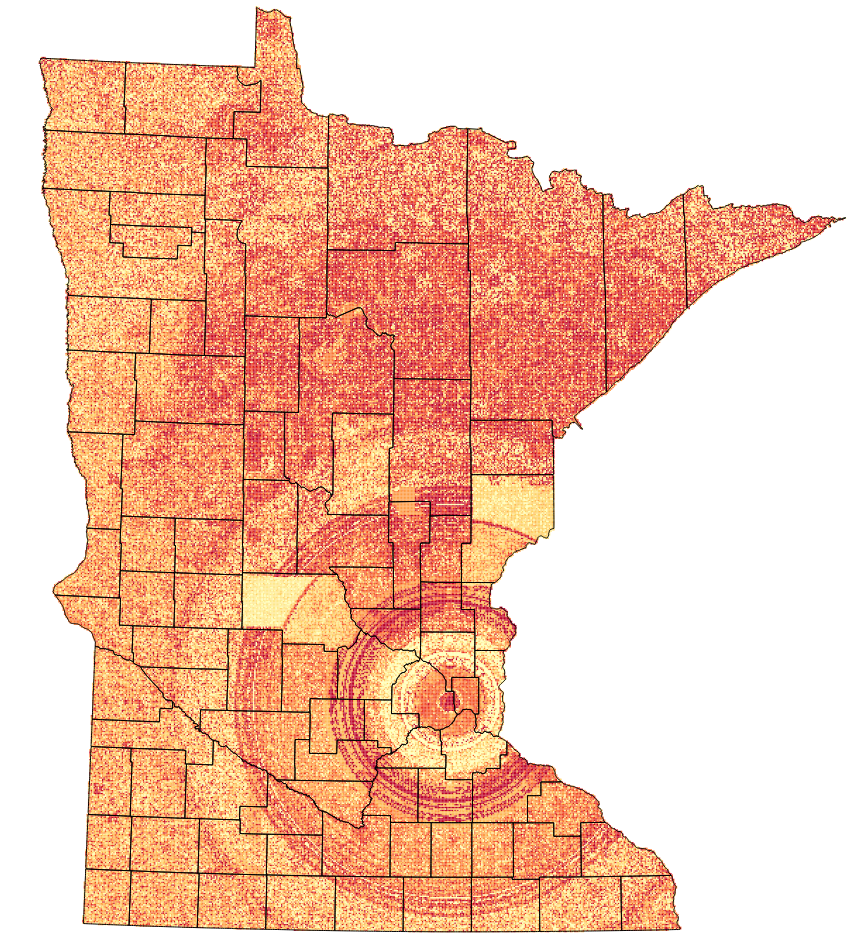
Our processing model caught a non-standard classification for flight-path overlap in Pine County, resulting in a visible striping pattern in the solar data.
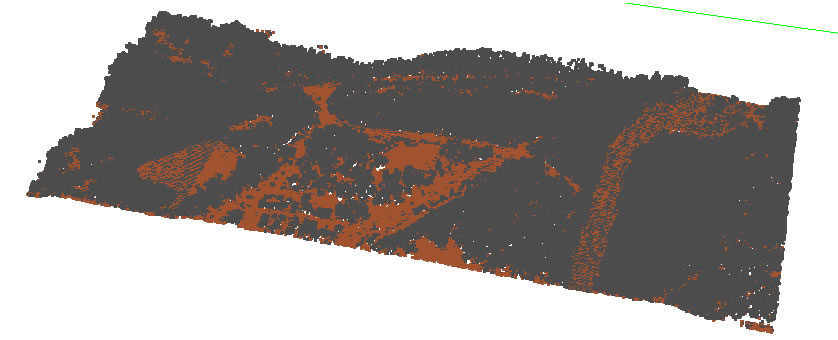
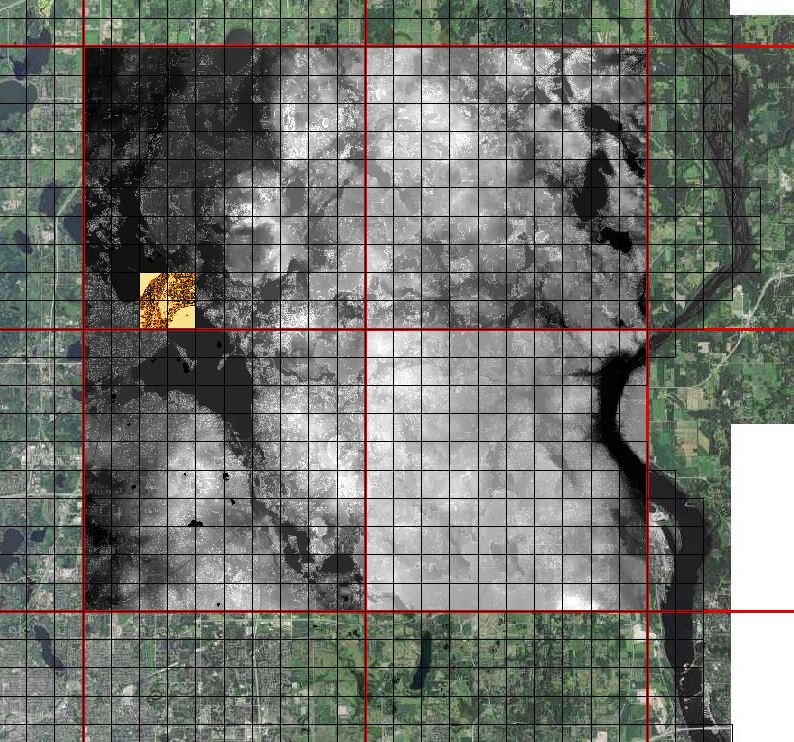
Crow Wing County lidar point cloud, colored by classification.
Brown is ground, gray is unclassified. Points representing buildings, trees, and more are present but unclassified in the lidar data.
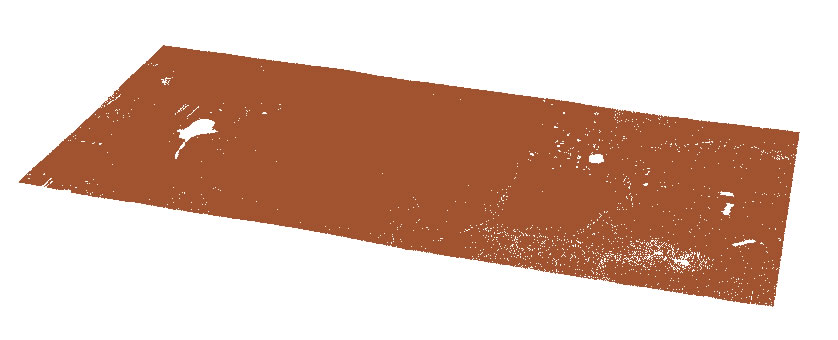
Chisago County lidar point cloud, colored by classification.
Only the ground points are contained in the lidar data. New data will be required to create a digital surface model.
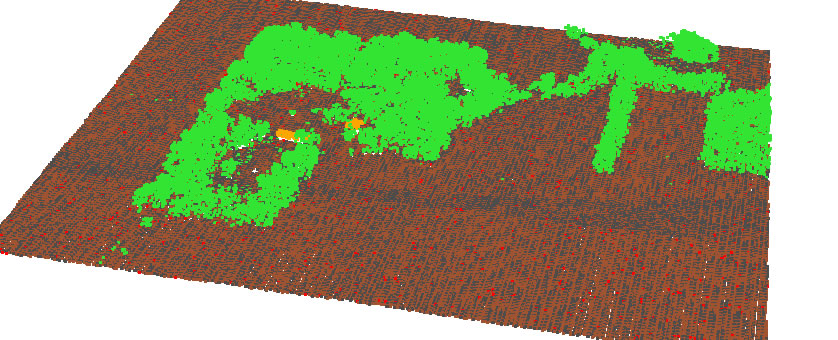
Pope County lidar point cloud, colored by classification.
This is the standard point cloud classification found in the majority of the lidar data.
Accurate classification for vegetation points (green) and buildings (orange) on a small farmstead in western Pope County.
2014 GIS/LIS presentation slides available here.
Five Minute Solar Project Crash Course PDF available here
(click to enlarge and use arrow keys to advance as slideshow)


To view the scripts we used to process our data follow the link to our GitHub repository. Along with the code, there is a readme that will help guide you along our process.

Git Hub/Solar Scripts